Draw first, then measure. On your own machine.
FlowVisual brings the FLOWREFY method to the desktop: model processes from building blocks, let a stress test expose your most expensive bottleneck, and prove the improvement in euros and time, before you switch a single piece of software.
Version 1.2 · macOS via the App Store · Windows via the Microsoft Store
Guide: how to use FlowVisual in 45 minutes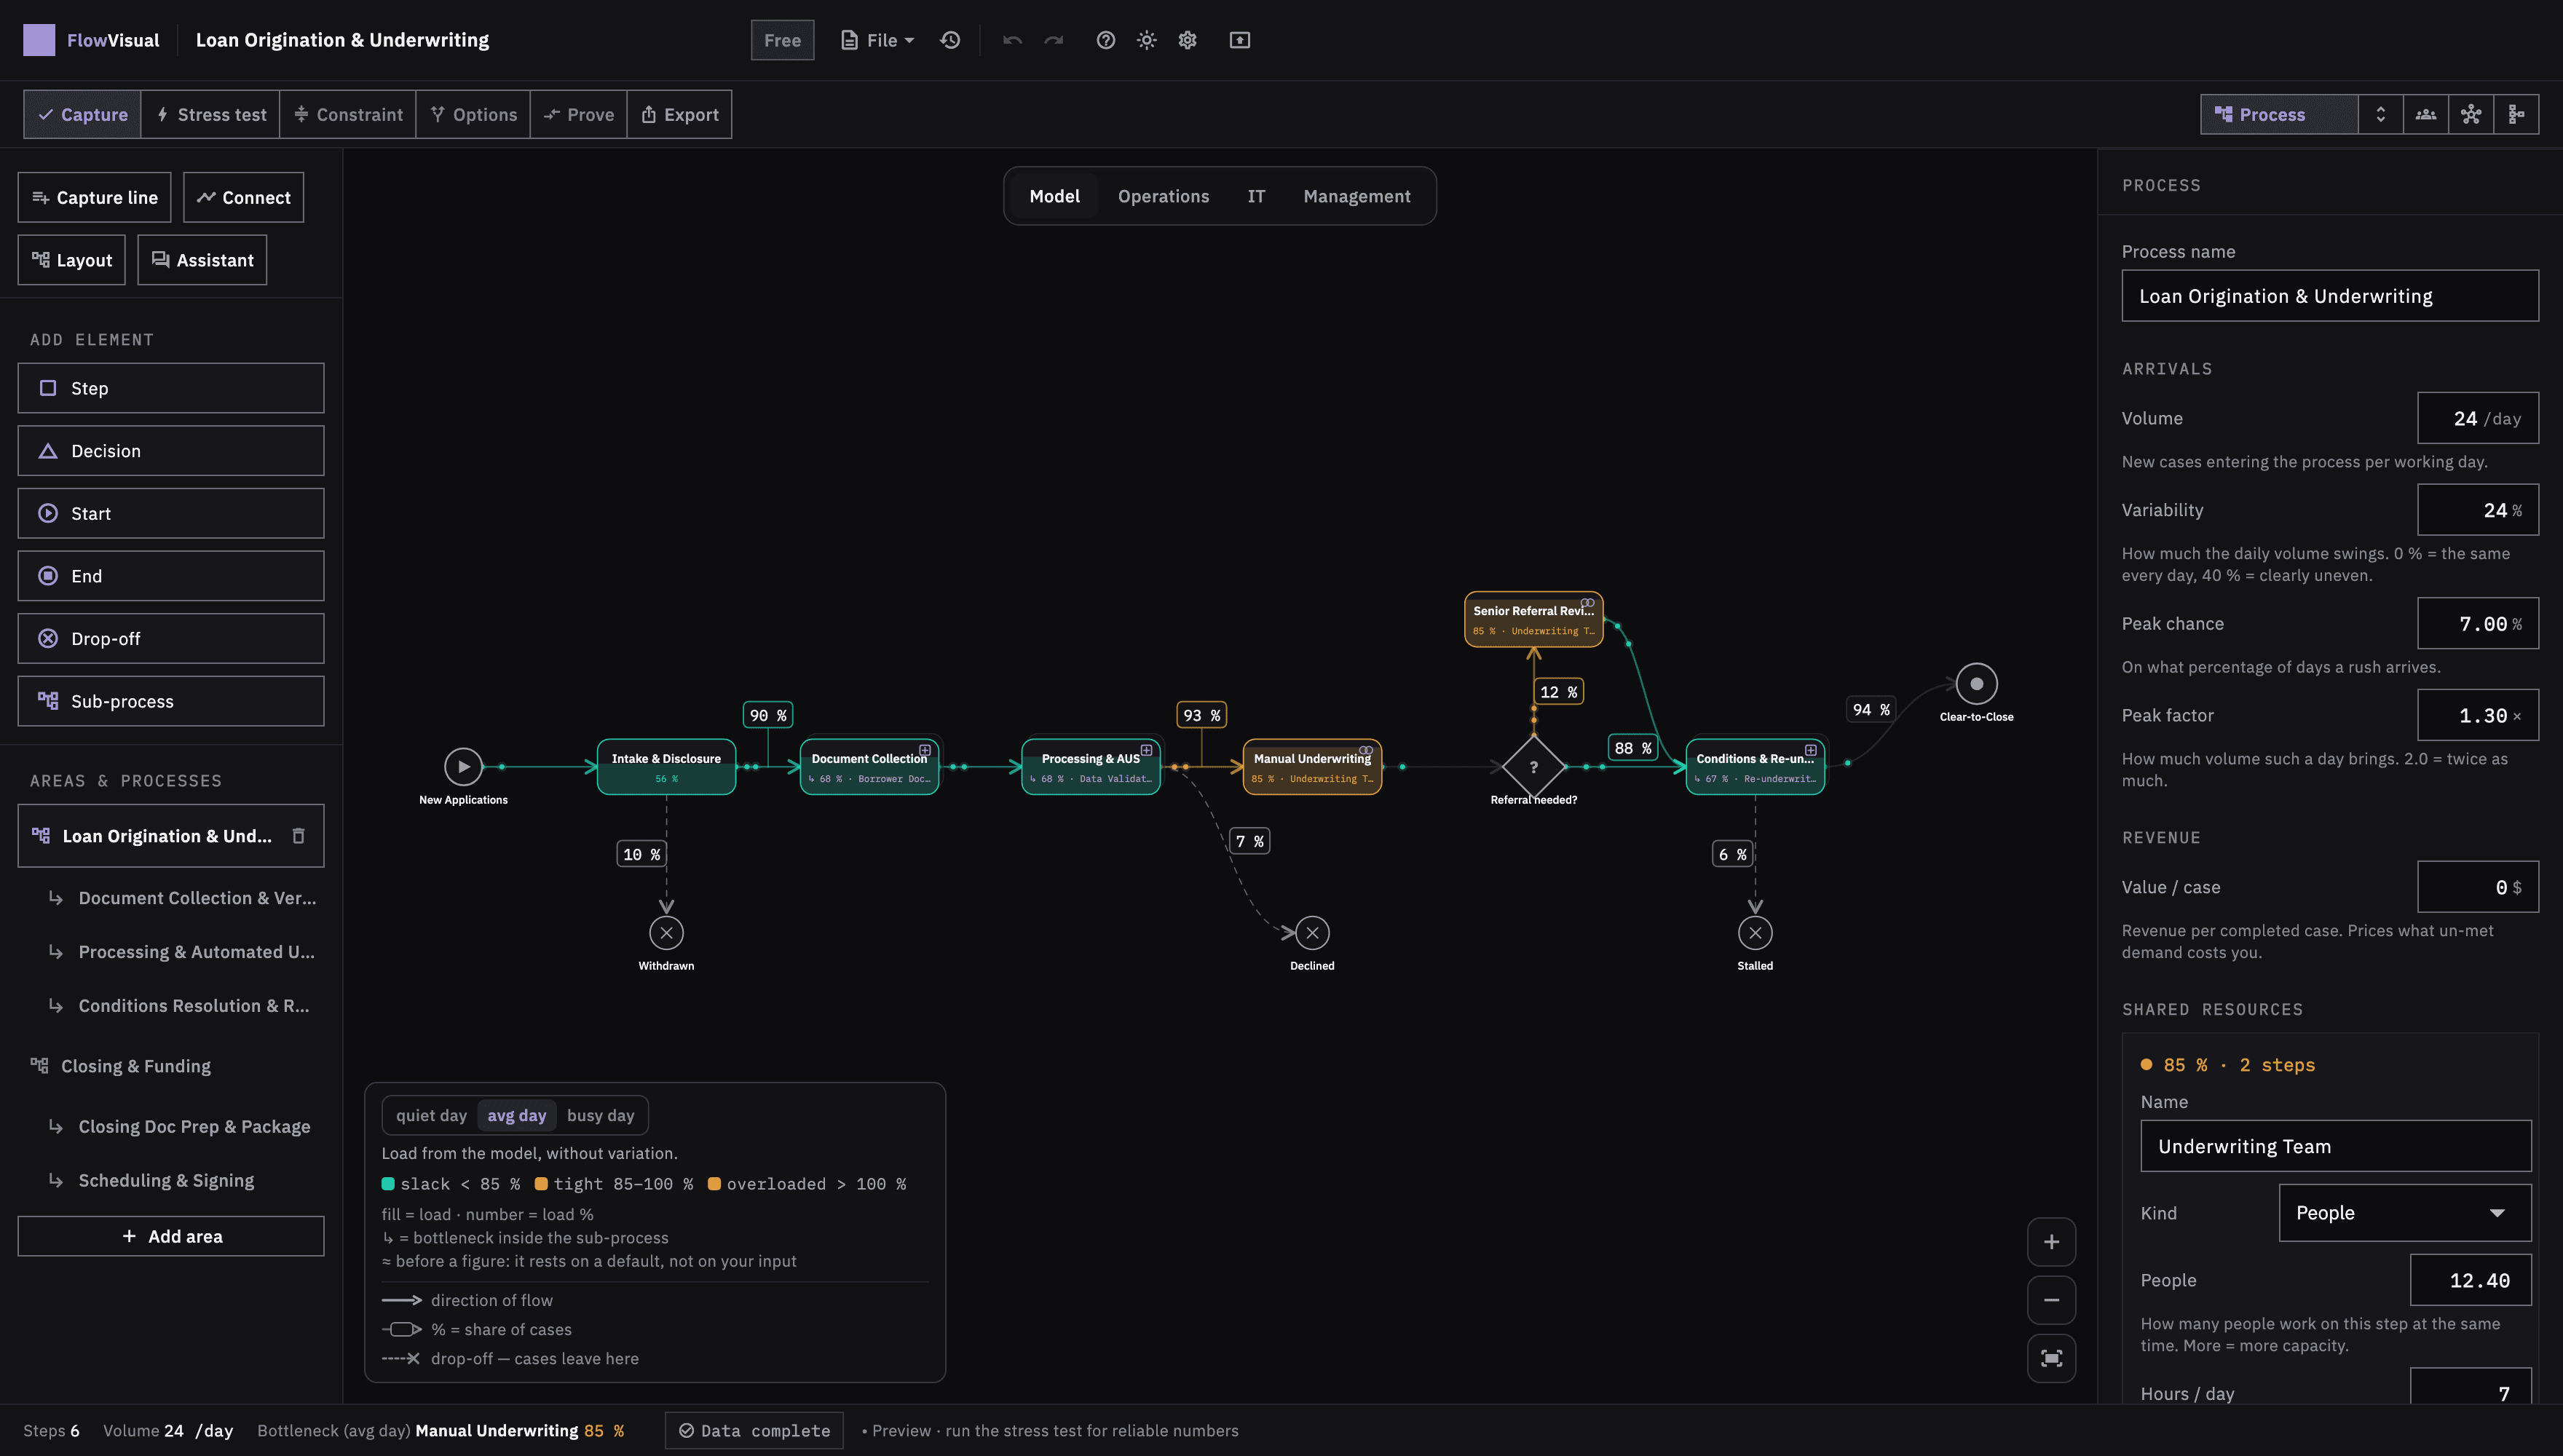
From a process on paper to a number you can defend
Four lenses on the same model — model, domain, IT, management. One result: you see where it jams and what relieving it is worth.
Model the process instead of describing it
- Steps, decisions, start/end and sub-processes in a click
- Areas and processes cleanly structured in the sidebar
- Live preview with real-time bottleneck highlighting
Click your flow together from steps, decisions, drop-offs and sub-processes. Areas and processes live in the sidebar, and the live preview flags the bottleneck instantly. No BPMN degree required.
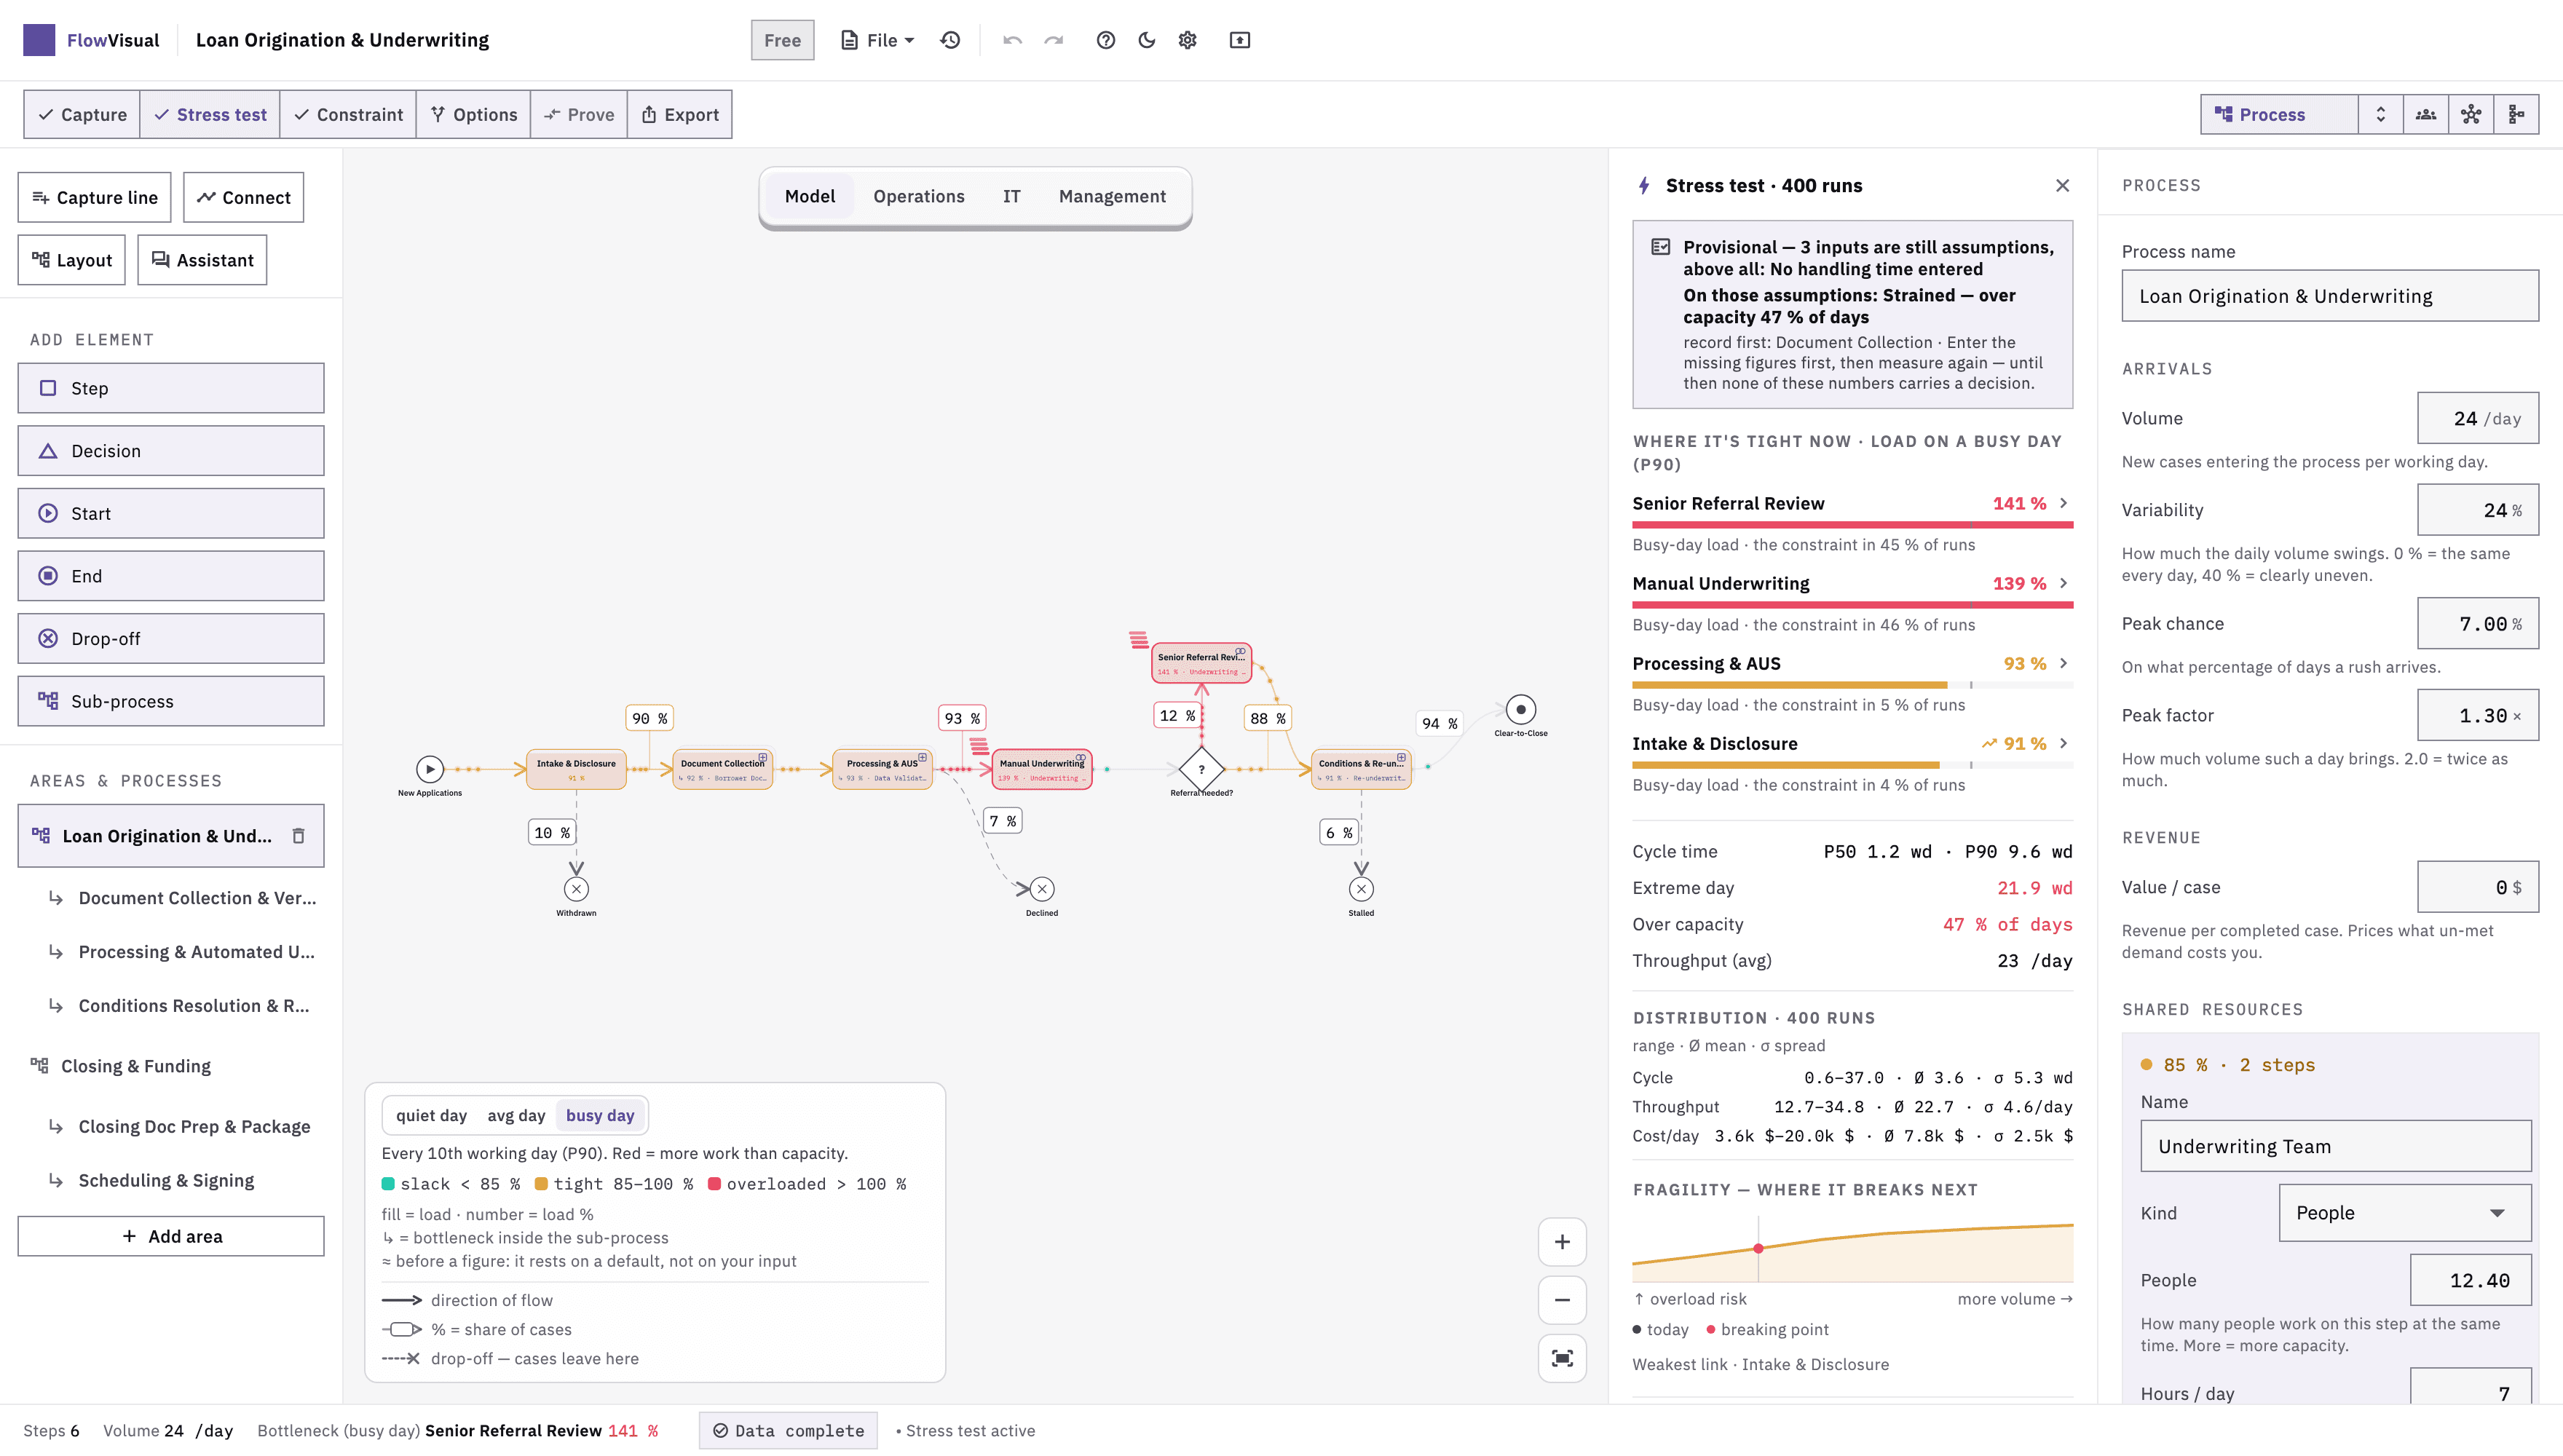
Stress test instead of a guess
- Load on the peak day (P90) instead of an average
- Cycle time as P50, P90 and extreme day — no false precision
- Throughput, days over capacity, and the headroom that is left
A stress test across a few hundred random working days shows which step saturates first — with load on the peak day (P90), cycle time as a range up to the extreme day, throughput, and the share of days over capacity.
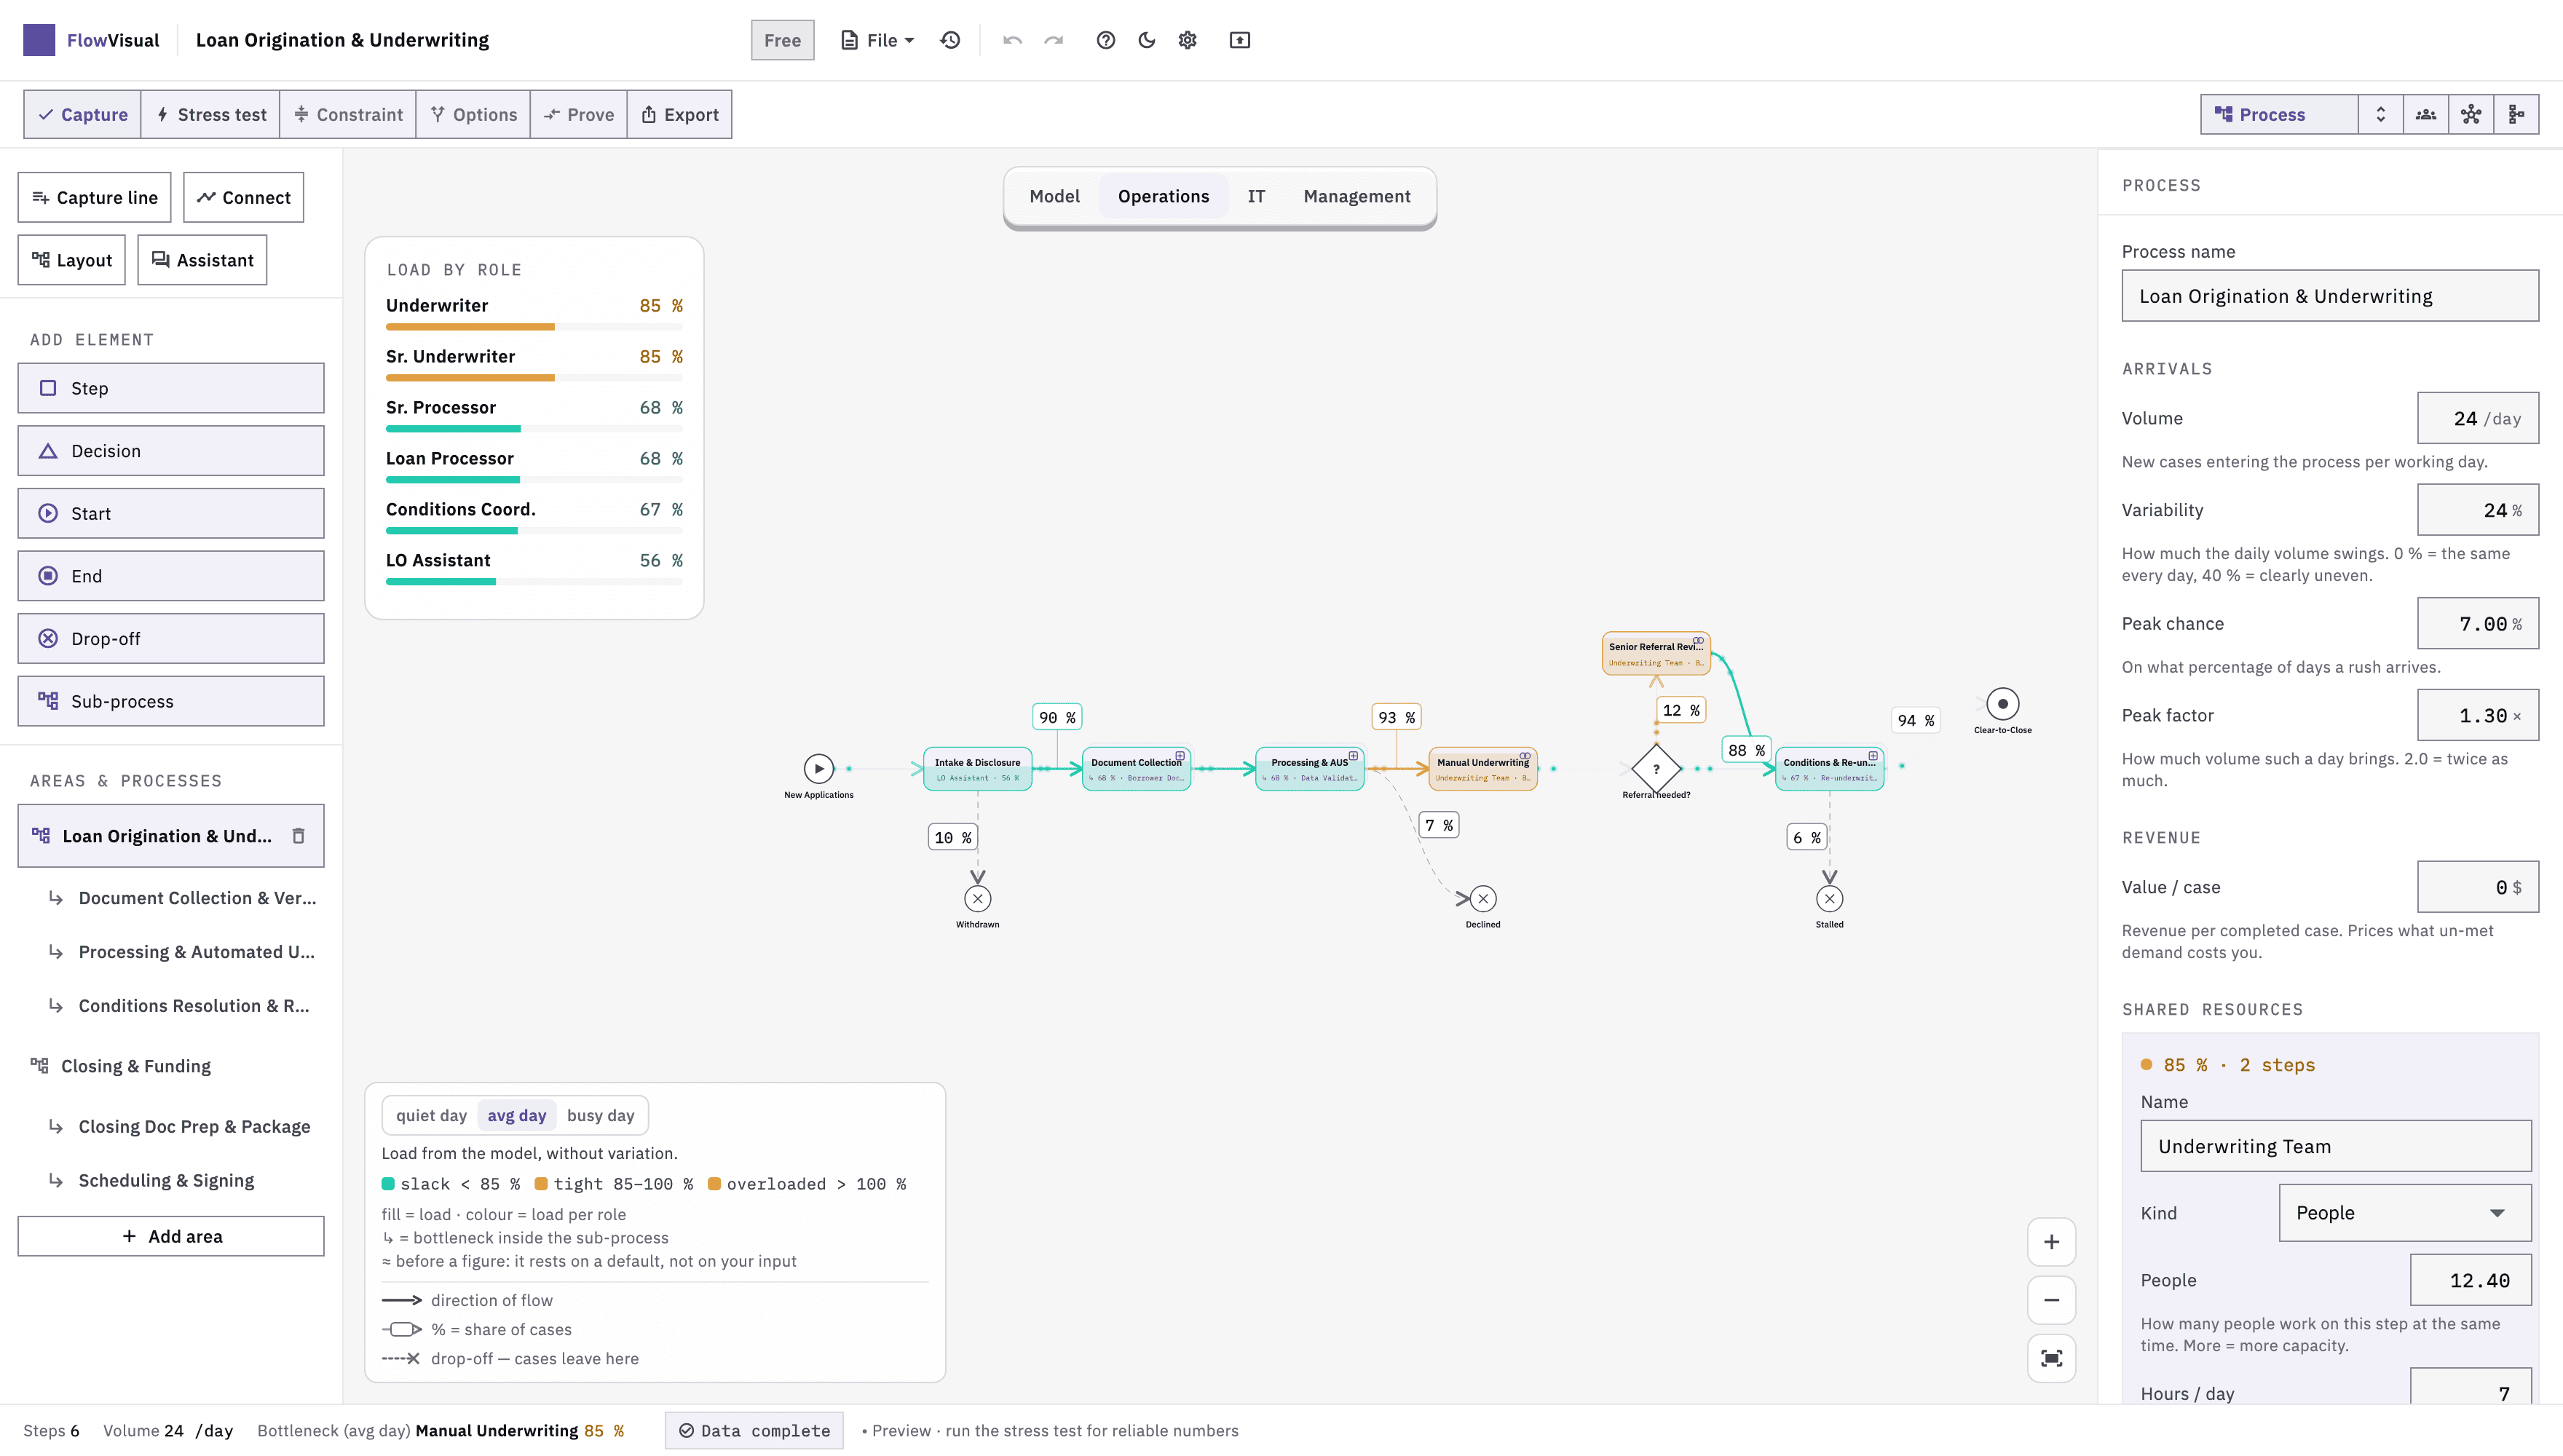
Make load per role visible
- Utilization per role in percent, colour-coded
- Overloaded roles spotted instantly
- Evidence for re-distribution instead of gut feeling
Who is overloaded, who has room? The domain lens colours utilisation per role: comfortable below 85 %, tight up to 100 %, overloaded above. That is the basis for redistributing work before you think about new hires or new software.
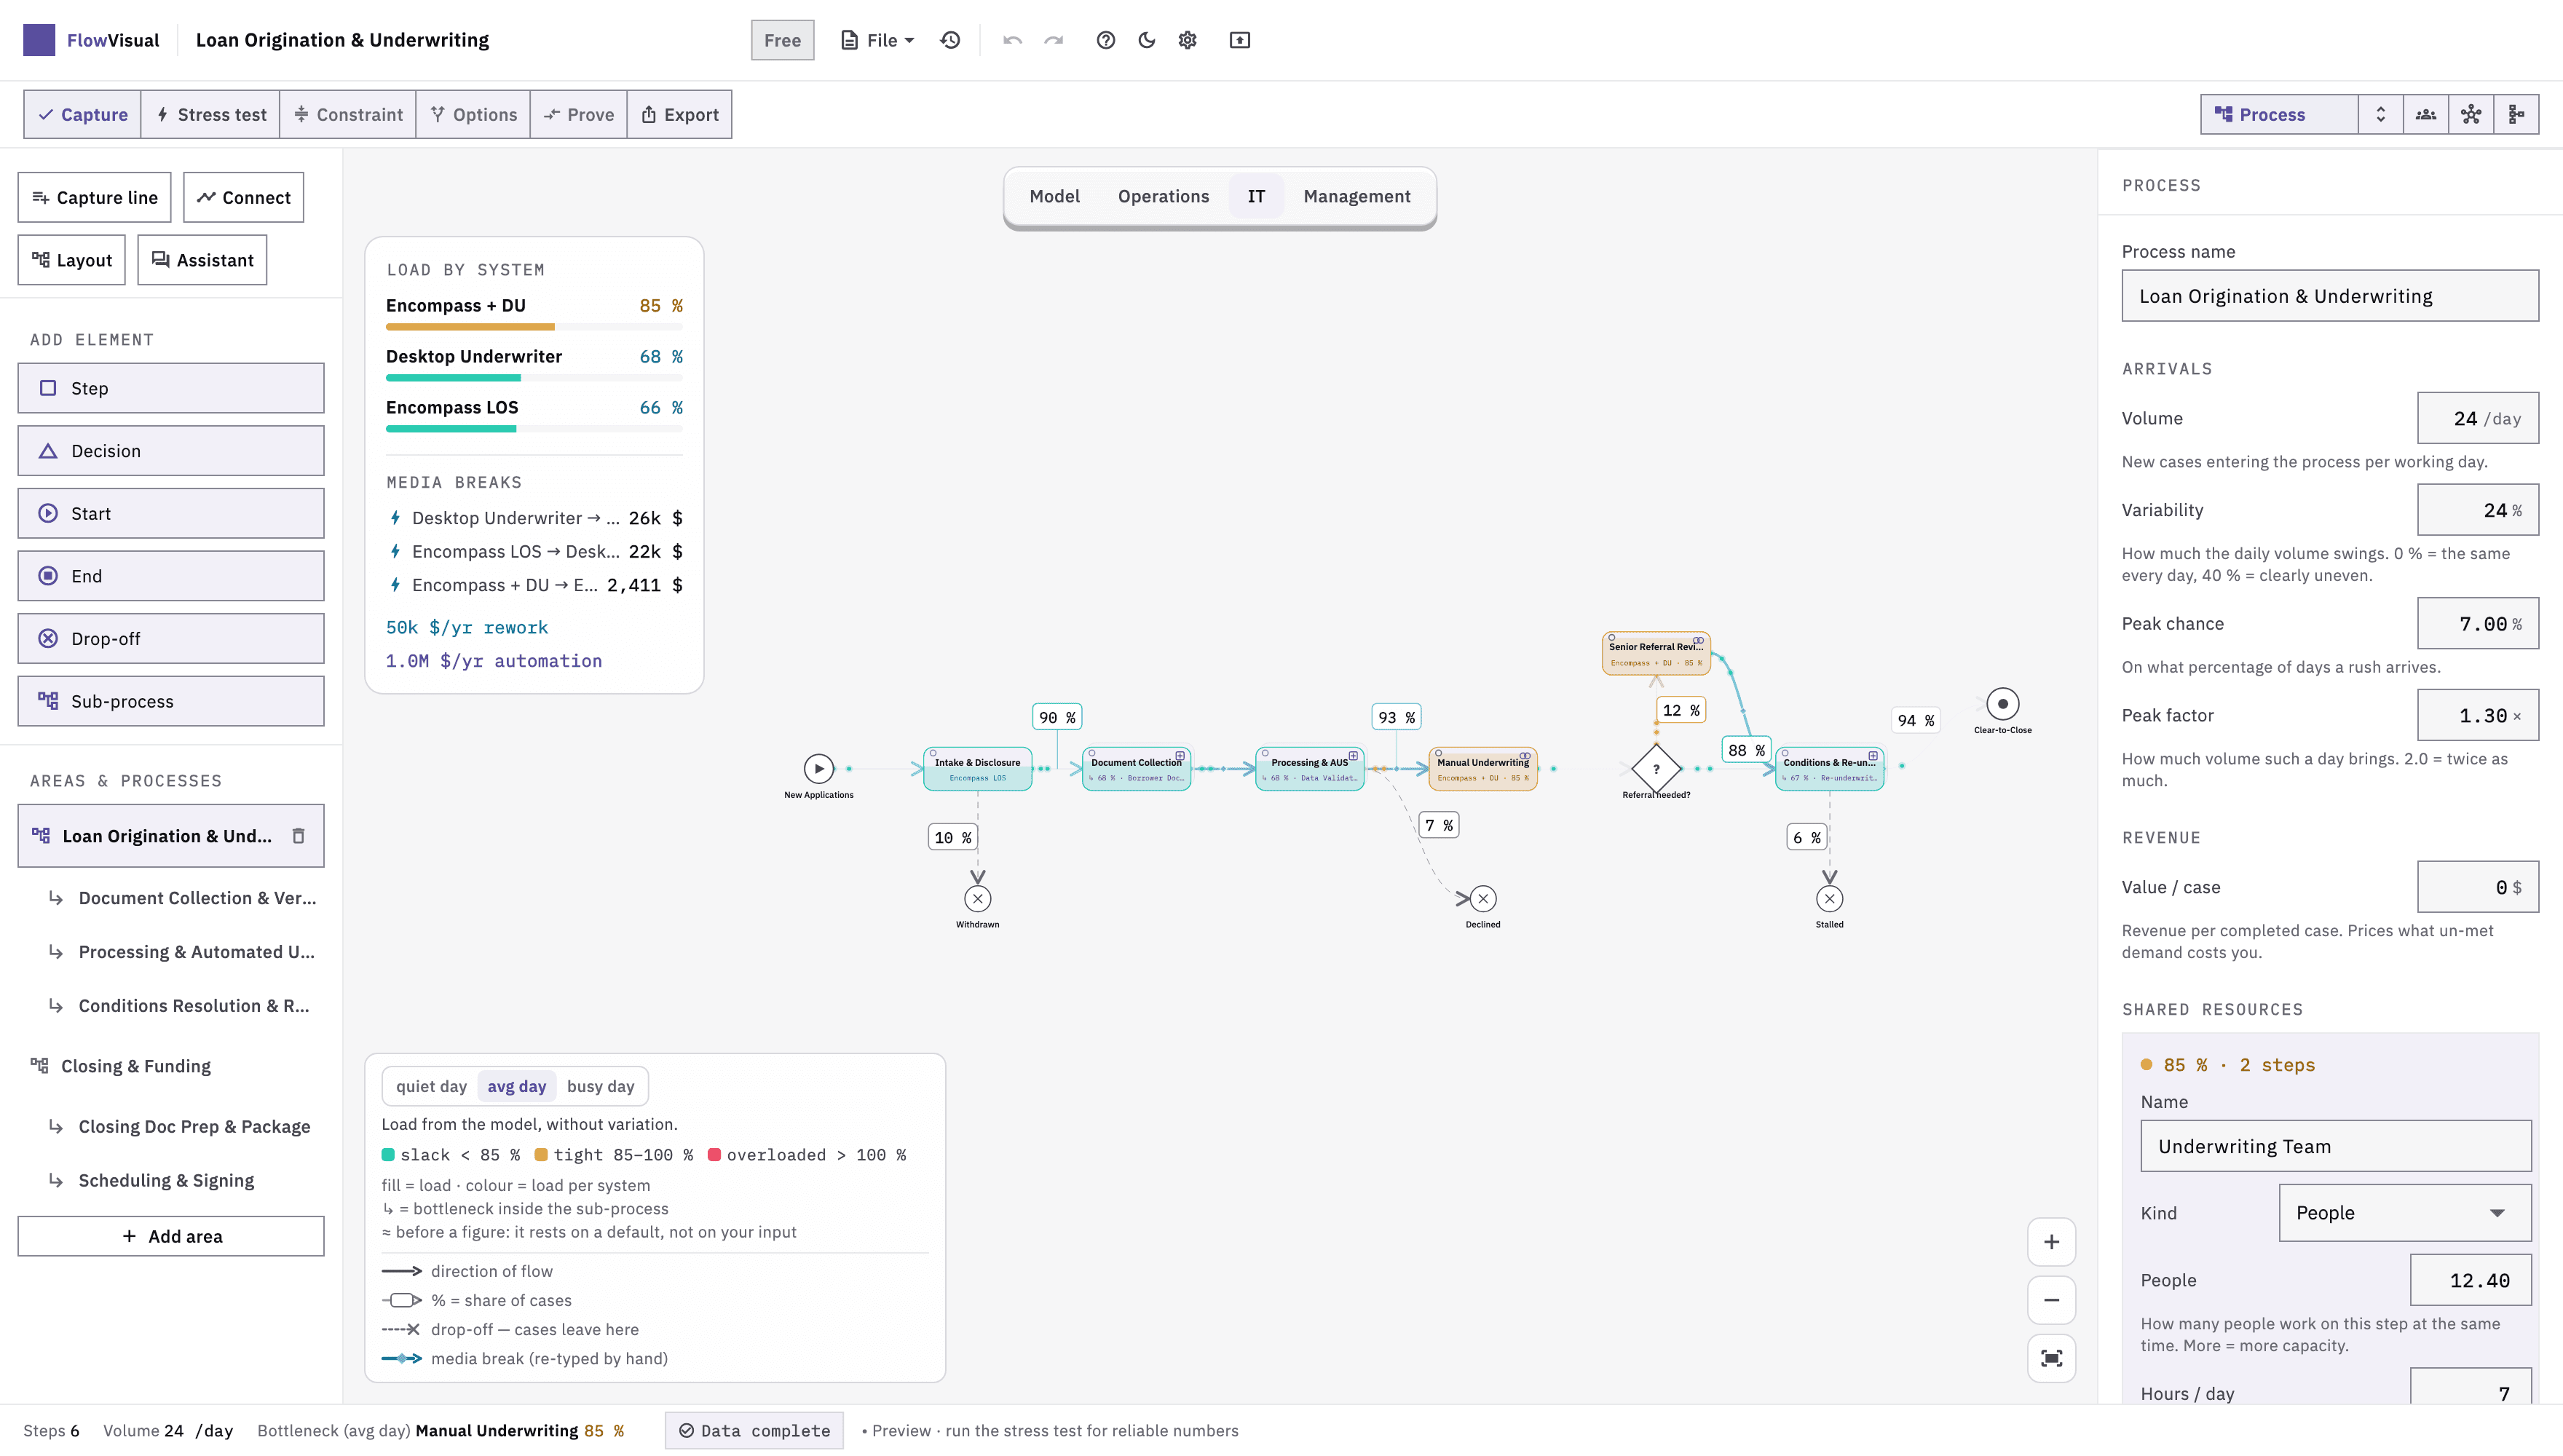
Media breaks and automation potential in euros
- Load per system, not only per person
- Media breaks visible exactly where data gets retyped
- Value per measure in euros per year, as a range rather than a point
The IT lens shows load per system and reveals the points where data is carried by hand into the next system. What closing such a break would be worth is computed in the options list, in euros per year — before the digitisation project, not after it.
A process is not a sum.
Try it yourself: same process, four situations — a demand spike, a supply shortage, staff out sick. Watch the bottleneck move, and watch whether a person or a system is the limit. That decision is the whole point.
Your bottleneck is not a property of the process. It is a property of the situation.
The same five steps, four situations. One run draws one duration per step — one possible day. Five hundred runs make a distribution. Switch the situation and watch the bottleneck move.
An ordinary month. Nothing unusual happens — which is exactly what every process is designed for.
- Capture the order—
- Technical review—
- Material / supplier—
- Approval—
- Dispatch—
3 h 03 min
The figure everyone calculates.
—
—
This gap is where deadlines break.
- Capture the order0 %
- Technical review0 %
- Material / supplier0 %
- Approval0 %
- Dispatch0 %
What comes out the other end
Every analysis in our archive was produced with this instrument. Same model, same Monte Carlo run, same evaluation — the only difference is that those are our processes, and the next one is yours.
- AN-2026-08
The sales lead who shows up as two boxes
A packaging printer measures the path from incoming order to order confirmation. The bottleneck is the credit check. The second finding is a role two steps share, and it only becomes an action once the first one is dealt with.
Read - AN-2026-07
The loudest process in the building is not the most expensive
An engineering consultancy wants to digitalise leave requests. The measurement agrees with the complaint and still not with the investment. The process is slow, but cheap.
Read - AN-2026-06
The €500 approval limit nobody has touched since
A plastics processor has every purchase above €500 signed by the managing director. The limit is old, the prices are not. Four out of five orders pass through a gate that opens twice a week.
Read
Built for honest numbers
No false precision, no cloud requirement. A tool for decisions that hold up.
Ranges, not false precision
Every euro figure comes with a P10–P90 band. 5–10 minutes instead of a made-up 7.5. The way processes actually run.
Runs locally, no sign-up
No cloud, no account. Your files stay on your own drive. Ideal for sensitive process data.
Branded PDF
Export the before-and-after as a branded PDF. For your proposal, your business case or the steering committee.
Mac & Windows
Native desktop app for macOS (Apple Silicon & Intel) and Windows 10/11. Fast, offline, no browser lag.
Download FlowVisual 1.2
Version 1.2. Modelling, saving and PDF export are free — no cloud, no account.
Version 1.2 · macOS (Apple Silicon & Intel) · Windows 10/11
The instrument has its own address
flowvisual.app carries the product itself: system requirements, version history and articles on process simulation, bottleneck arithmetic and business cases that hold up.
FlowVisual — product site
Four views, pricing, download, FAQ — and a process simulation running live in the browser.
flowvisual.appHow to calculate a bottleneck
Utilisation, Little's Law and Kingman's formula — why 85 % utilisation is already too much.
flowvisual.appProcess simulation software compared
Drawing tool, BPM suite, simulation lab or decision instrument — four categories, four purposes.
flowvisual.appProcess costs in Excel: four mistakes
Why cost spreadsheets systematically overstate savings — and how to spot it before the CFO does.
flowvisual.app
Frequently asked questions about FlowVisual
No. FlowVisual runs entirely locally on your machine. There is no sign-up and no server. Your process files stay on your own drive.
No, deliberately not. FlowVisual is intentionally simpler: you click the process together from building blocks in minutes instead of learning a notation. It's about measuring, not documenting.
You enter volumes, variability and capacities. The Monte-Carlo stress test turns them into ranges (P10–P90) instead of false precision. Probabilities rather than a single wishful number.
Modelling, saving and the PDFs are free; the PDF then carries a watermark and the standard header. Pro removes both and adds your own letterhead, Word export and team seats — from 199 € per year for one seat, 399 € for three (gross prices). Through the App Store it runs as an annual subscription with one free week.
Rather do it together? We'll model your most expensive process with you.
Don't want to click it yourself? In 20 minutes we'll capture your most important process and show you the bottleneck in euros. With FlowVisual, live.
No sales pitch. No slides. Just straight talk.